Statistics turn the completed activities of a chosen period into charts: volume, training load, zones, plan completion, records and wellbeing.
OverviewStatisticsPick the athlete
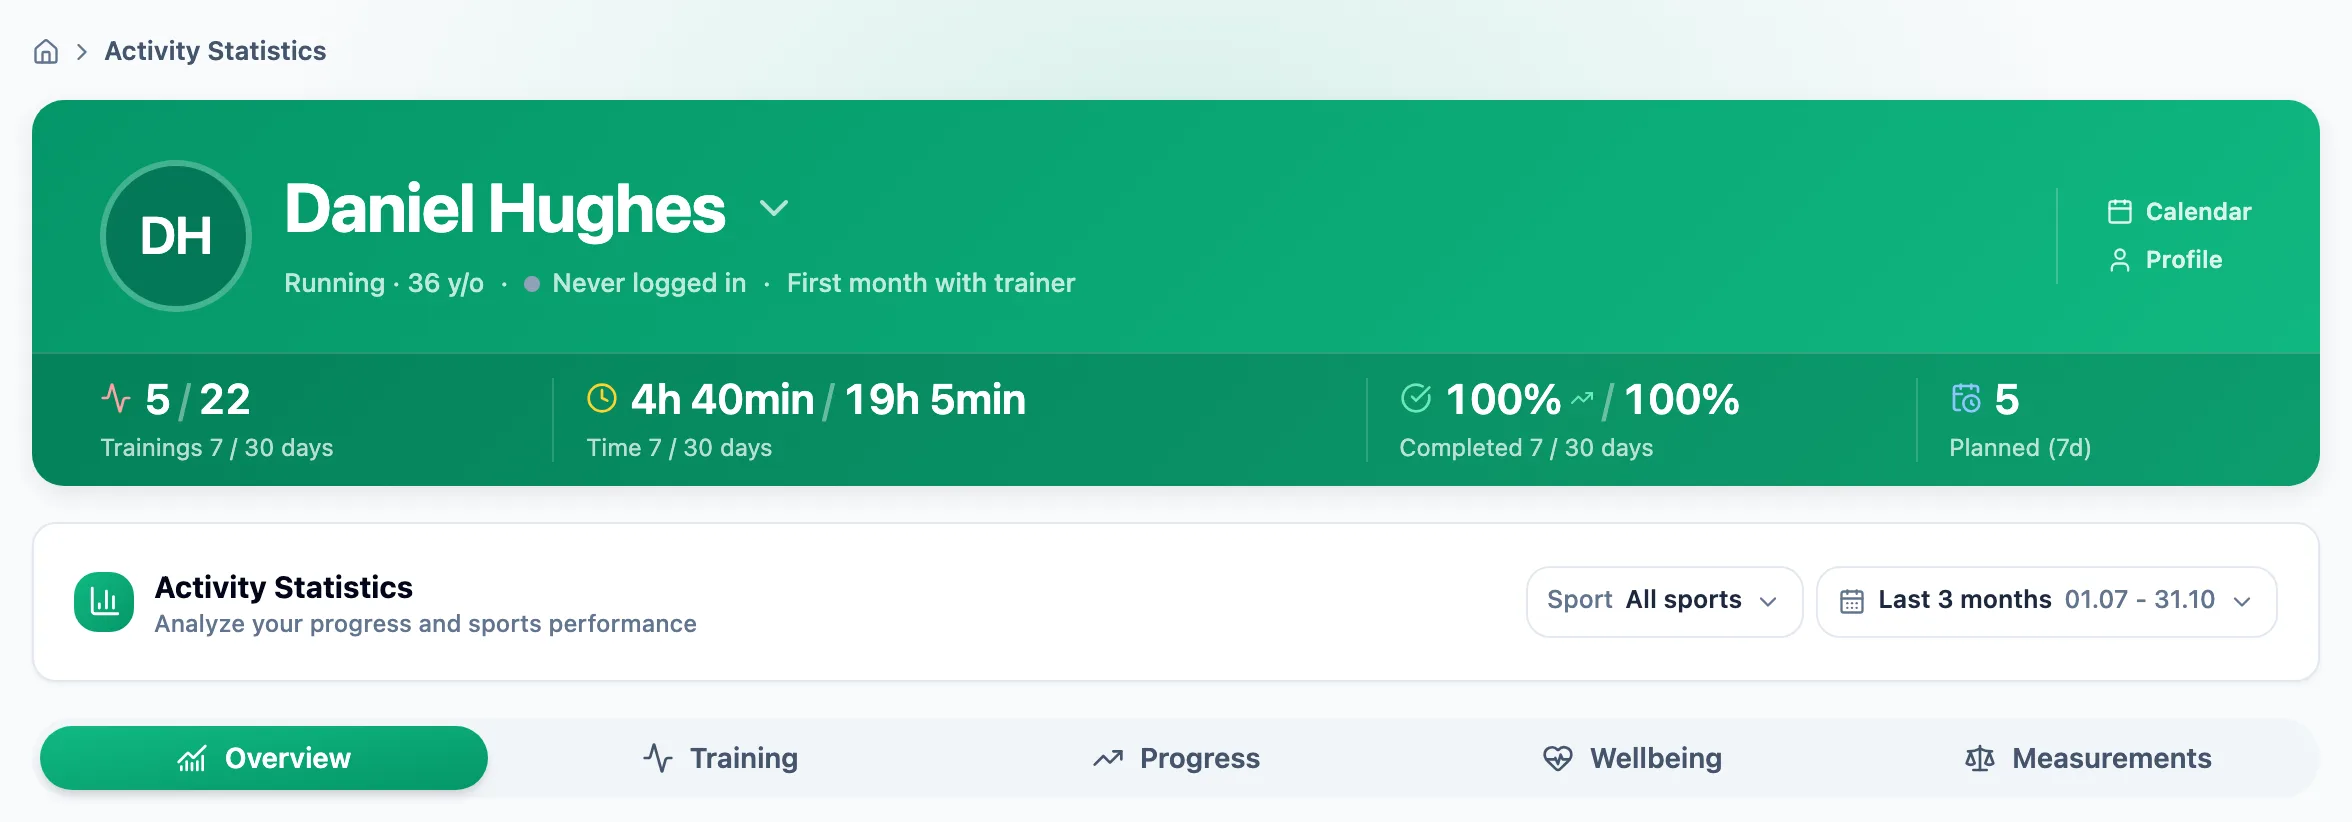
As a trainer, switch athletes with the arrow next to the name in the header; the athlete overview has a shortcut to the same view. Athletes see their own statistics straight away.
Set the sport and range
The Sport field narrows the charts to one discipline or keeps All sports. The range is the last month, 3 or 6 months, a year, or a Custom range with start and end dates. The filters apply to every tab.
Move between tabs
Overview has Key numbers, compared with the previous period of the same length, and the Form chart. Training shows Training Load week by week, Time in zones, Workout Compliance and Training volume.
Follow progress
Progress brings together Year-over-year volume, Threshold history, Period records, Races and records and Aerobic efficiency (EF). Records can be filtered by sport and kind, and the ALL-TIME badge marks the best result in the athlete's whole history.

Compare wellbeing with training
Wellbeing shows Perceived exertion, Wellness trend from the survey and Wellbeing vs load.
More in this section: Analysis
For coaches
Trainer dashboardWhat the trainer dashboard shows: team numbers, athletes who need attention, the weekly summary, upcoming workouts and competitions, and recent activities.For athletes
Athlete dashboardWhat the athlete dashboard shows: today's workouts, 7- and 30-day numbers, the weekly summary, your workout streak, recent activities and the plan ahead.For coaches and athletes
Training load and formWhere training load from power, pace, heart rate or RPE comes from, which athlete thresholds it needs, and how to read the load chart and the form chart.For coaches and athletes
Laps, charts and zonesHow to read the activity panel: the laps table, charts over time, drift and EF for a chosen range, and time in heart rate and power zones.For athletes
ReportsHow to submit a report your trainer asked for, read the trainer's reply and correct your own answer after submitting.