On this page
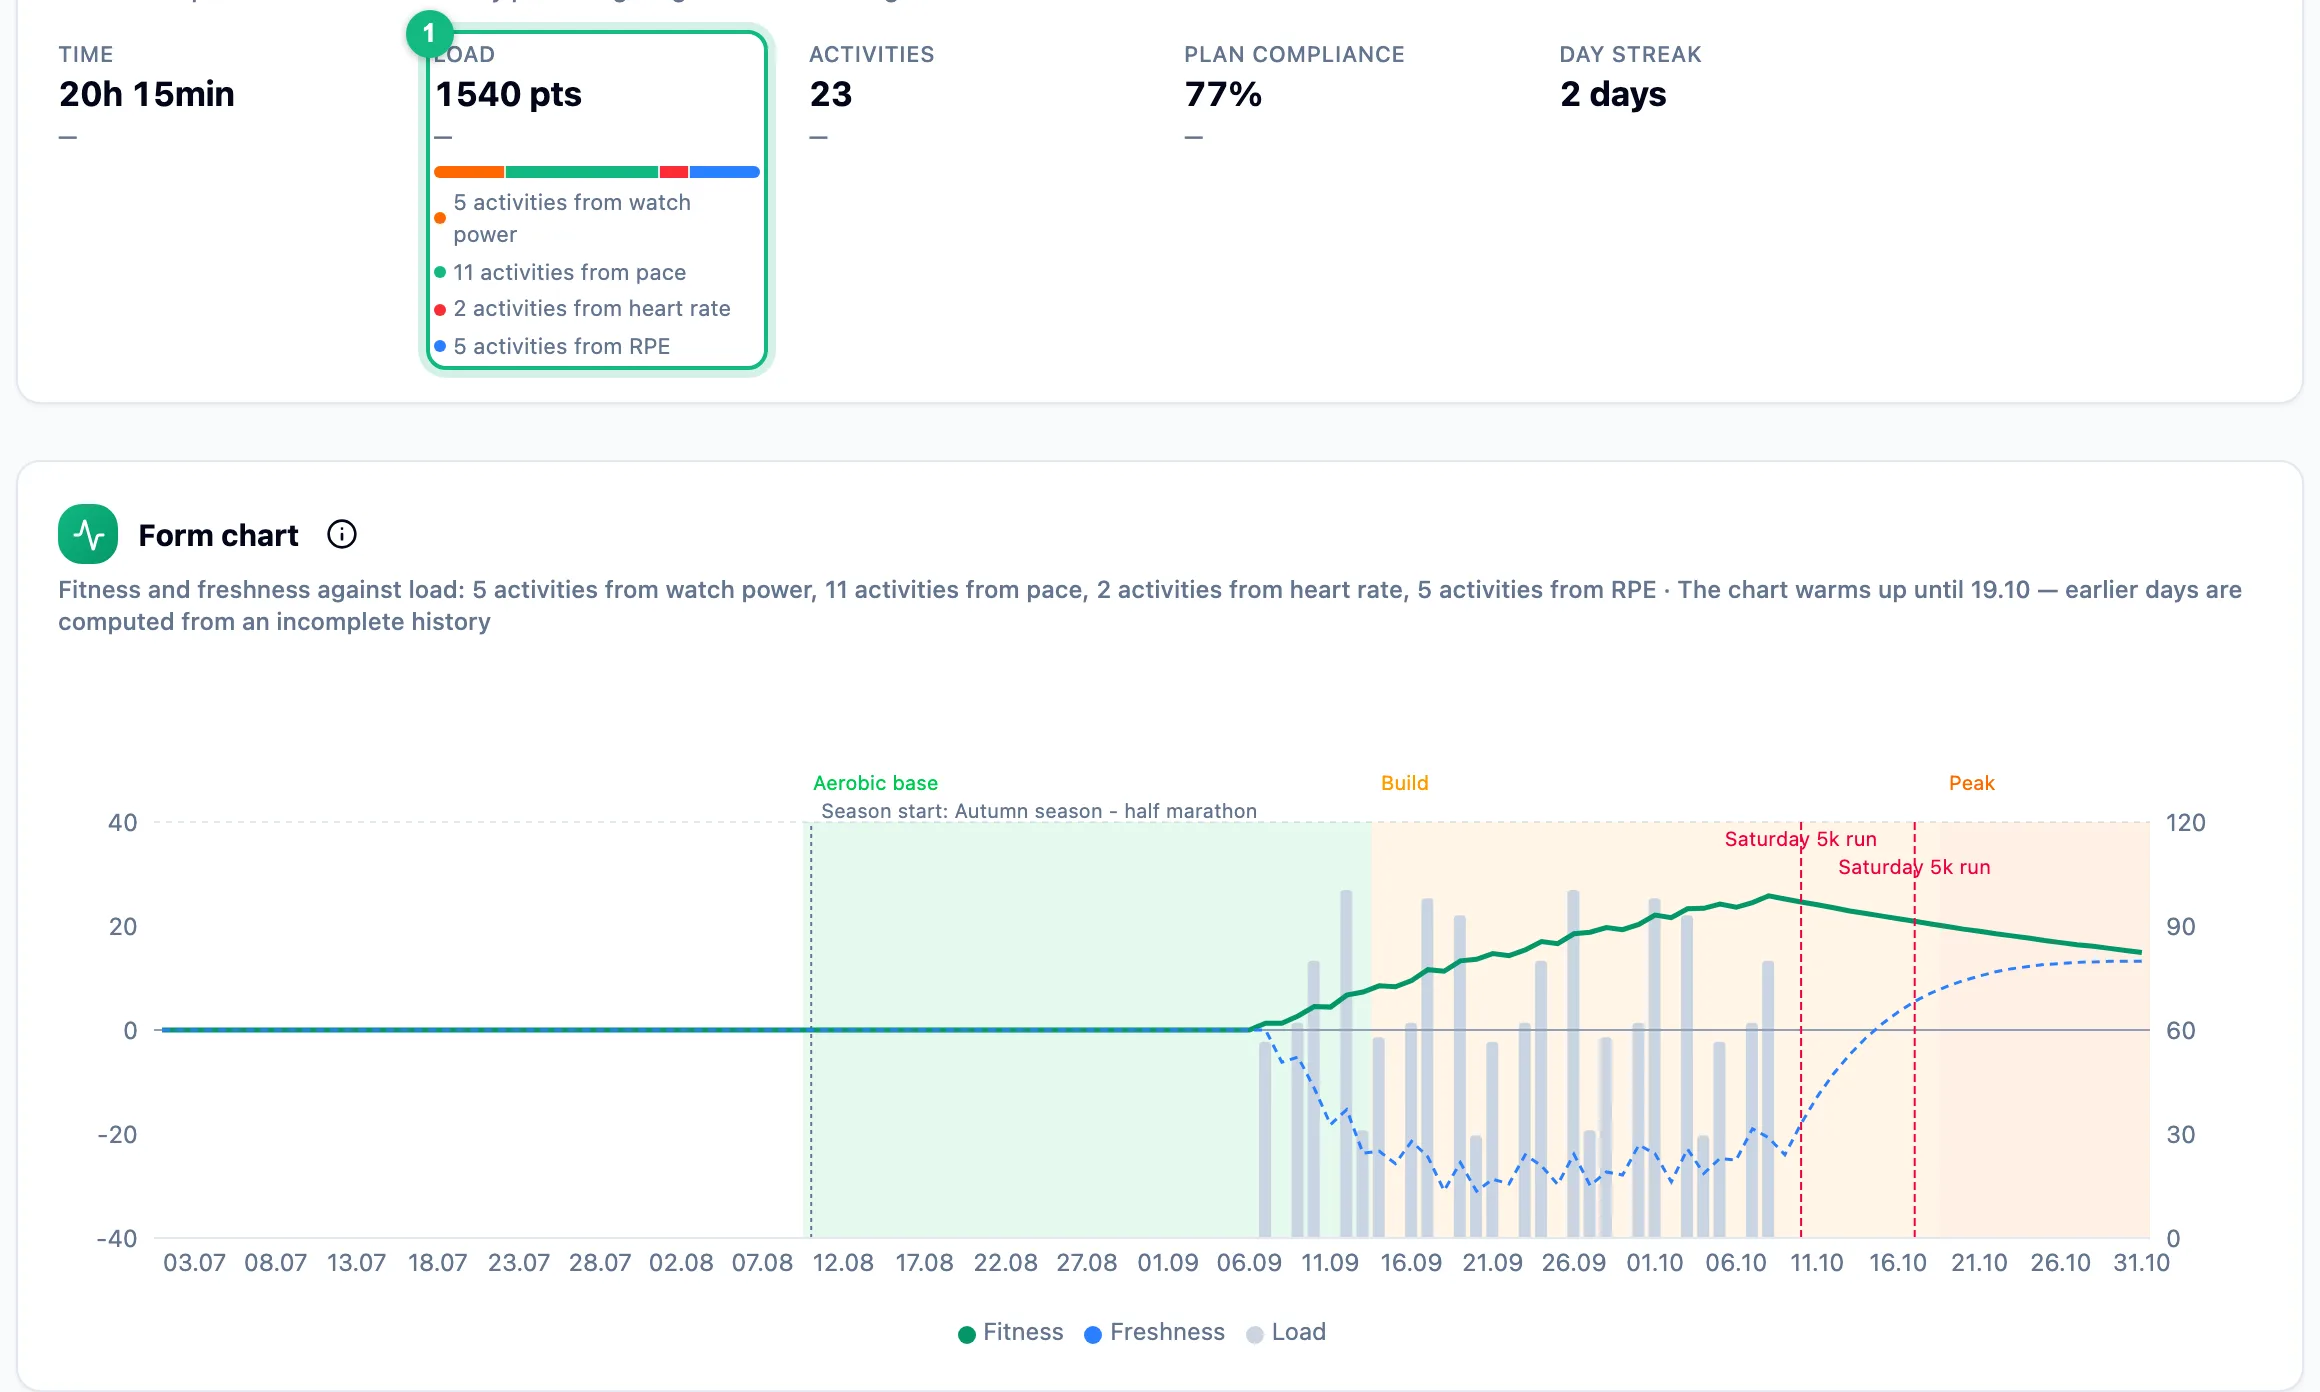
Training load turns the duration and intensity of a workout into one number, so sessions from different sports add up to a week and weeks line up into a form chart. There is one scale: 100 points is an hour at threshold.
OverviewStatisticsWhat the load is based on
Every activity gets one number, from the most precise data it has, in this order:
- Load from power: a ride with a power meter and an FTP set. If the watch already calculated load from power, the app uses its number.
- Load from pace: a GPS run when the athlete has a threshold pace. Uphills and downhills are corrected for gradient.
- Load from heart rate: any sport with a heart rate monitor, once maximum heart rate is set.
- Load from RPE: the 1-10 effort rating times the duration, when there is no measurement at all.
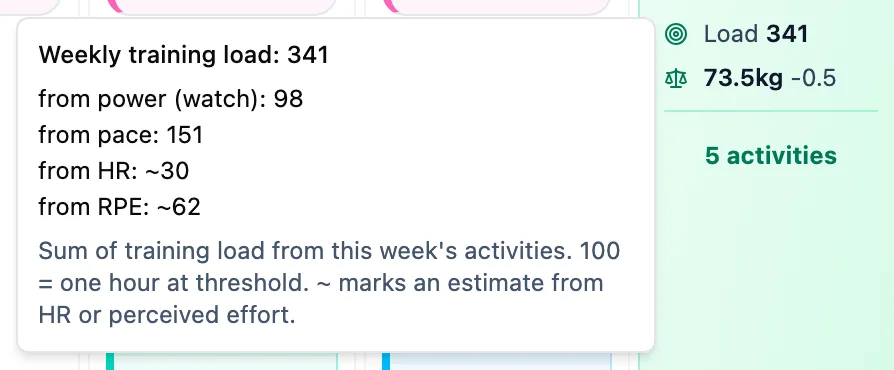
Power and pace are measured against a threshold; heart rate and RPE are estimates, so in the calendar their result carries a tilde, for example ~28. A workout with none of this data gets no load at all, rather than a zero that would drag the week down. On a treadmill, heart rate takes priority over pace.
Check the method in the activity panel
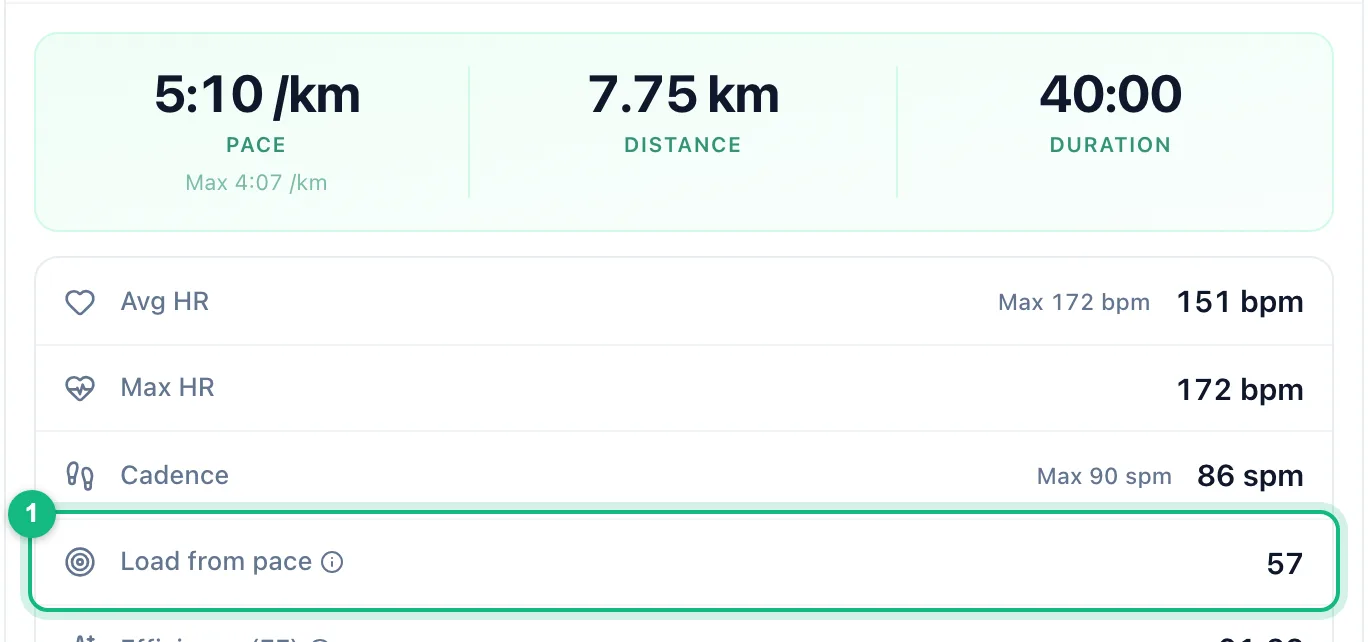
Click an activity in the calendar. The row label in the metrics tells you which method produced the number, for example Load from pace.
Set the athlete's thresholds
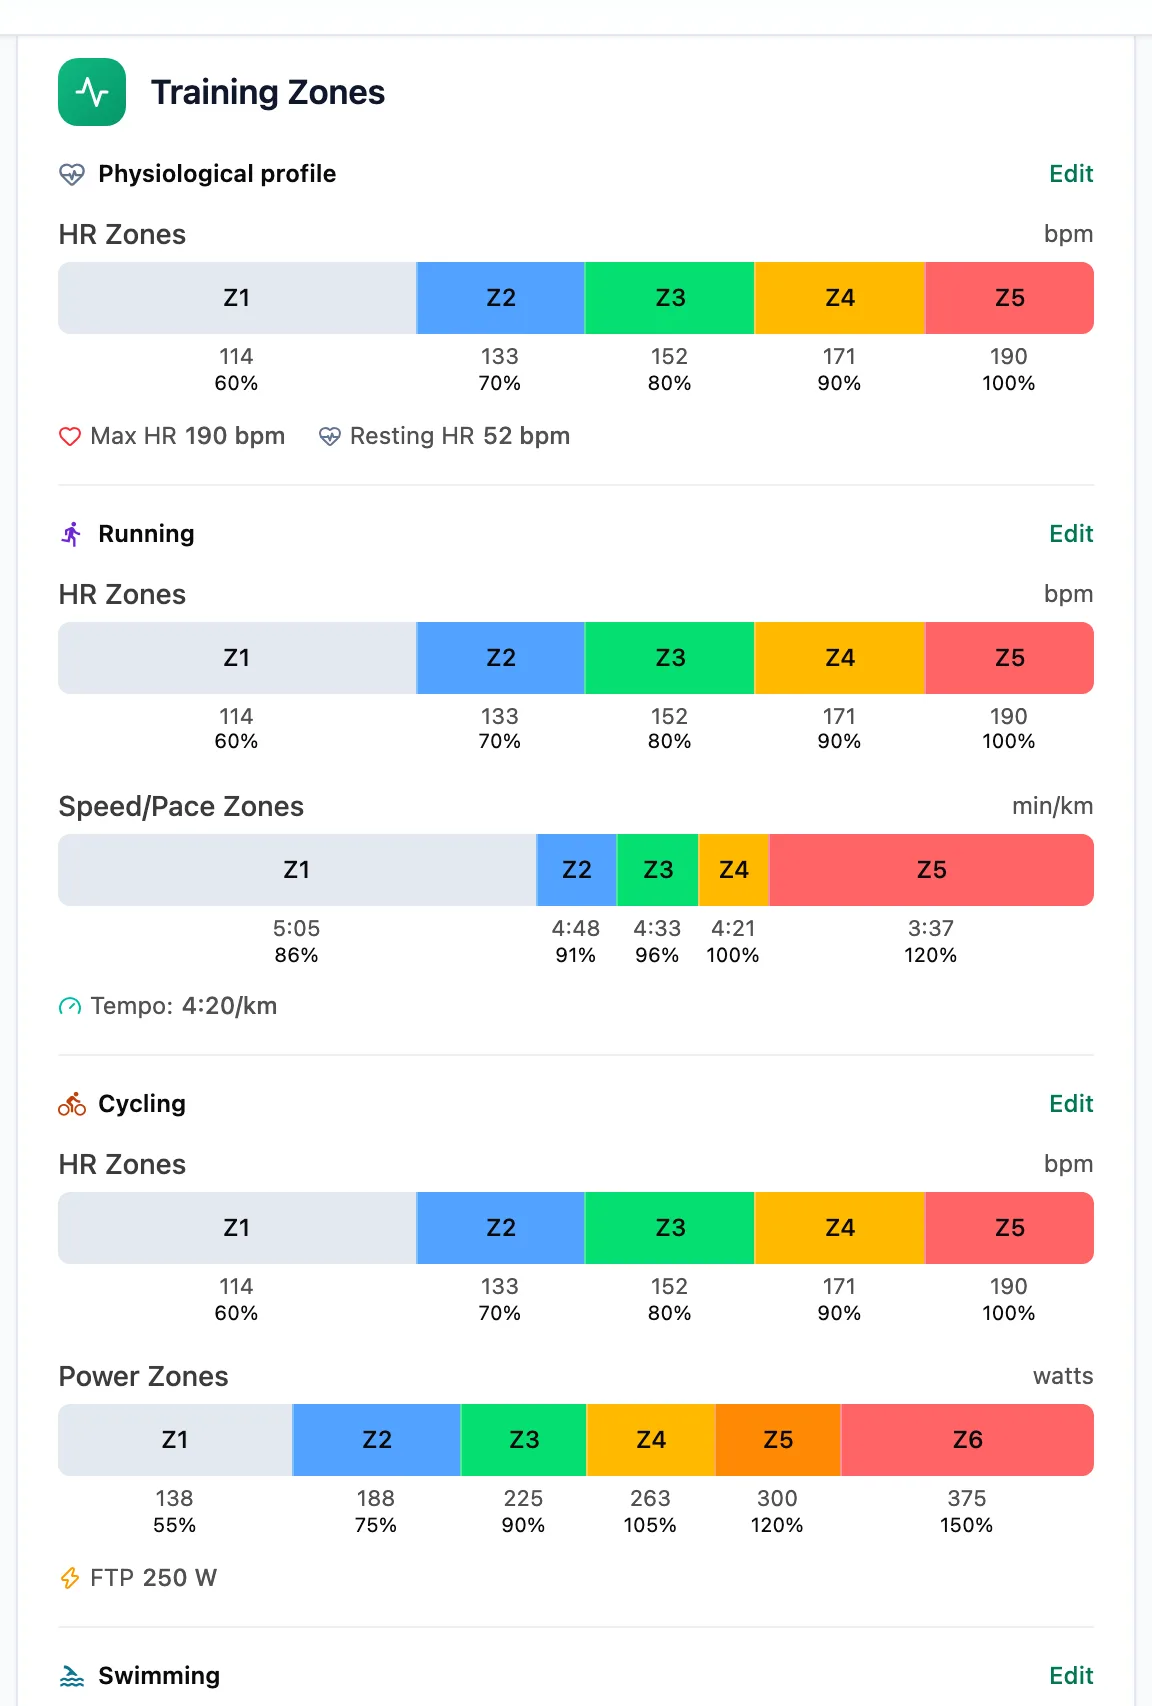
Without FTP, a ride with a power meter falls back to heart rate, and without maximum heart rate it falls back to the effort rating. The coach sets the thresholds in the athlete overview, in the Training Zones section. The athlete sets them in Profile, on the Athlete Data tab, in the Training Settings card.
Compare weeks
The weekly total sits above the calendar; hover over it to see the split by method.
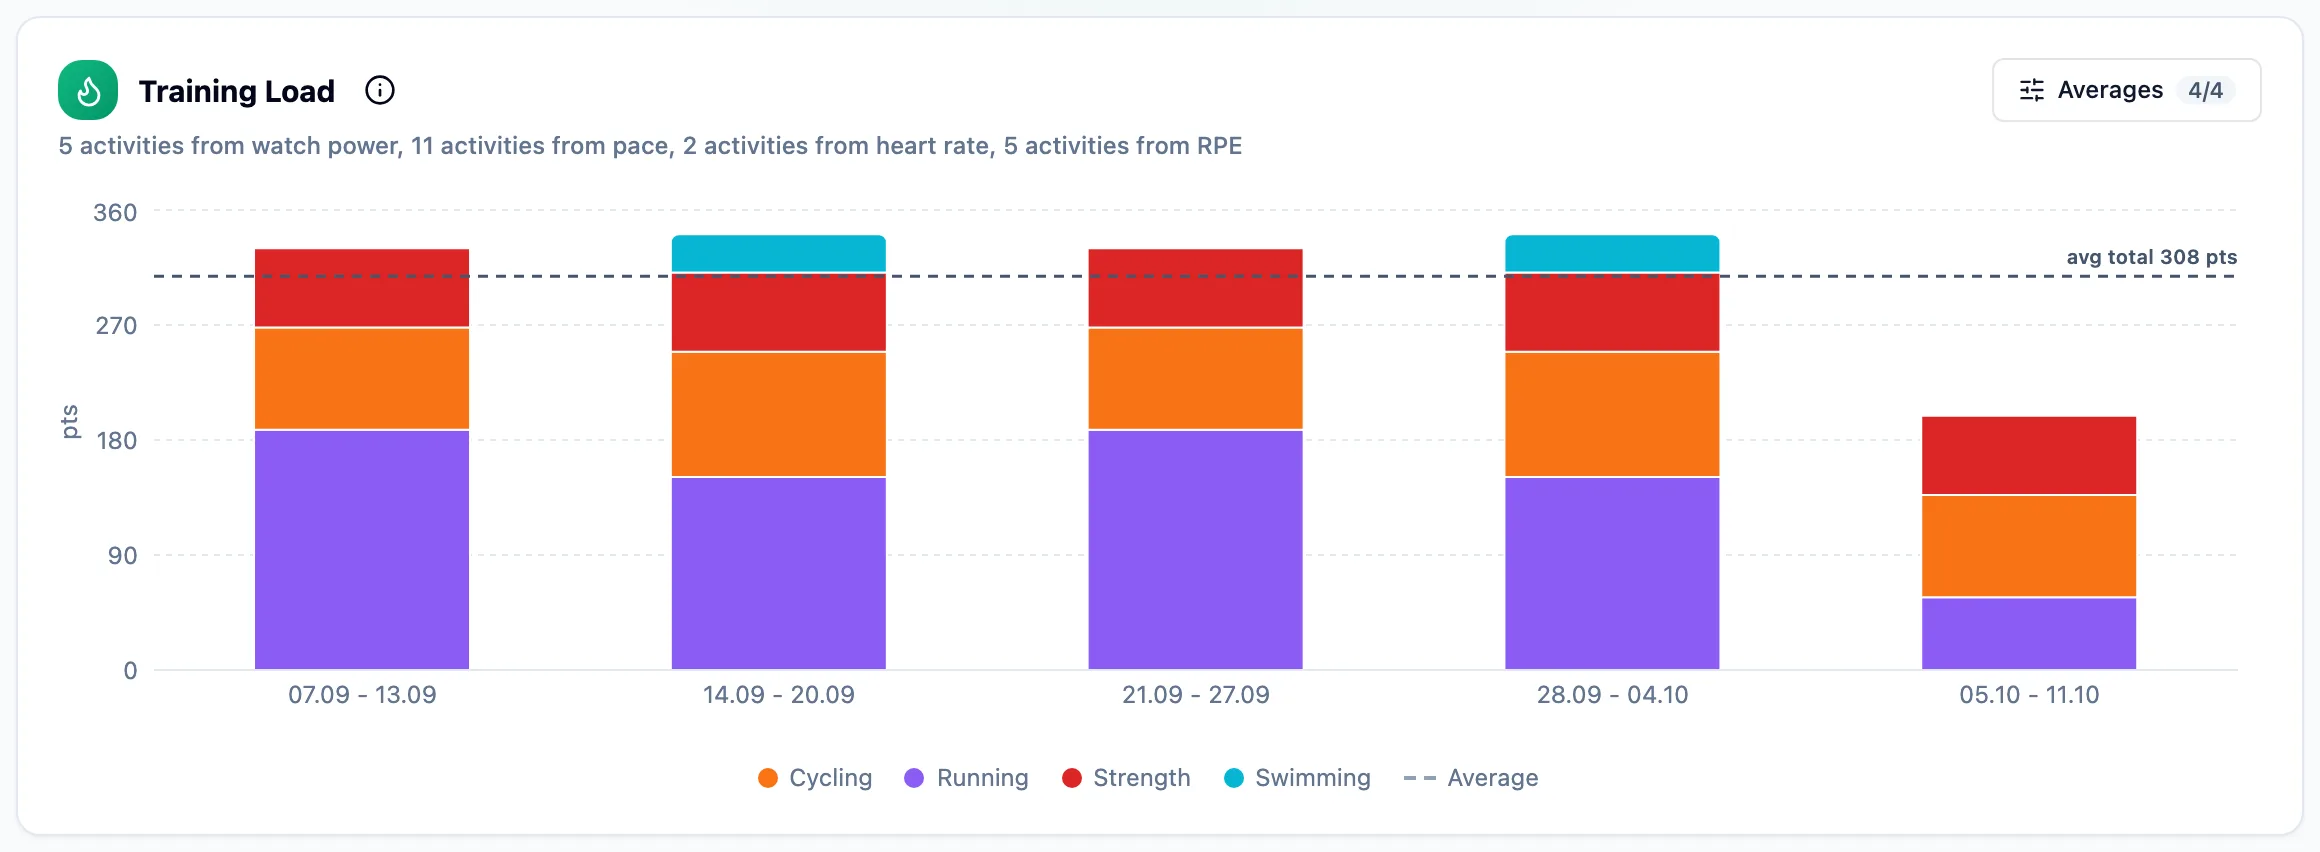
In statistics, on the Training tab, the Training Load chart puts weeks side by side, split by sport, and the line under the title says how many activities each method covered and how many have no load.
Follow form
The Overview tab has the Form chart. Grey bars are daily load, the Fitness line is the effect of roughly six weeks of training, and Freshness is the gap between that and the fatigue of the last week: below zero the athlete is building up fatigue, above zero they are rested.
More in this section: Analysis
For coaches
Trainer dashboardWhat the trainer dashboard shows: team numbers, athletes who need attention, the weekly summary, upcoming workouts and competitions, and recent activities.For athletes
Athlete dashboardWhat the athlete dashboard shows: today's workouts, 7- and 30-day numbers, the weekly summary, your workout streak, recent activities and the plan ahead.For coaches and athletes
StatisticsHow to pick the athlete, sport and date range in statistics, and what the Overview, Training, Progress and Wellbeing tabs contain.For coaches and athletes
Laps, charts and zonesHow to read the activity panel: the laps table, charts over time, drift and EF for a chosen range, and time in heart rate and power zones.For athletes
ReportsHow to submit a report your trainer asked for, read the trainer's reply and correct your own answer after submitting.